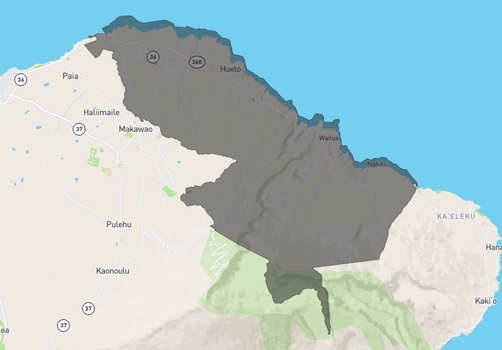
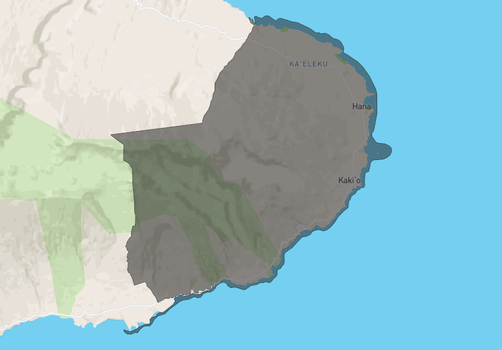
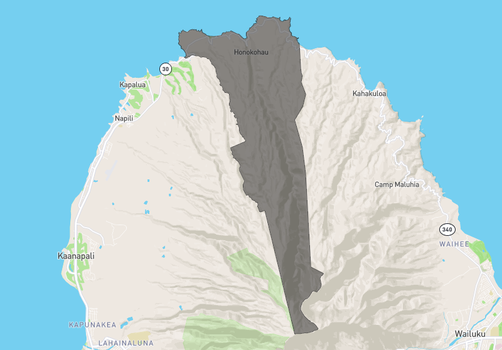
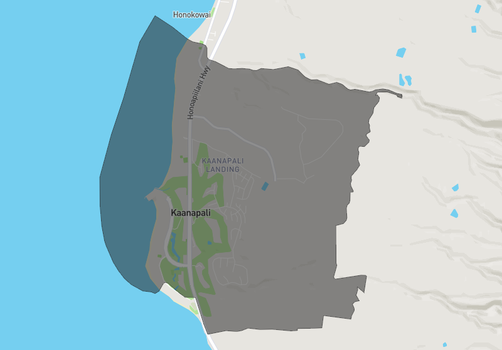
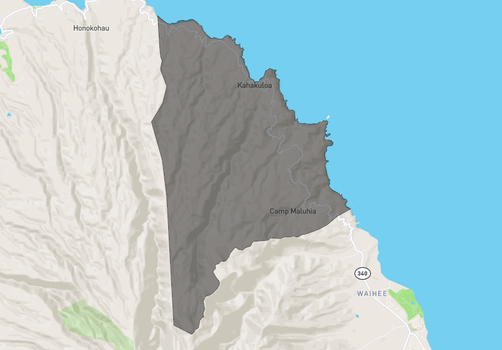
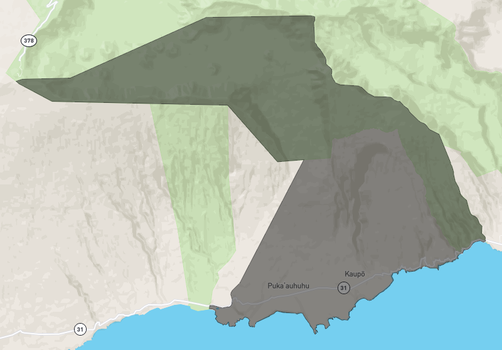
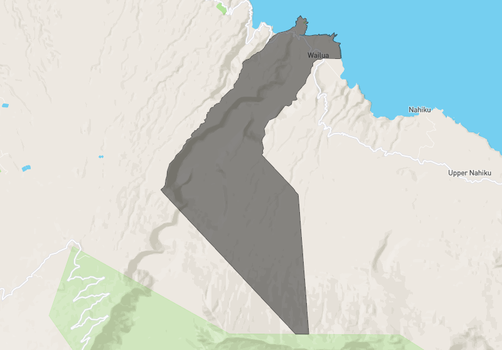
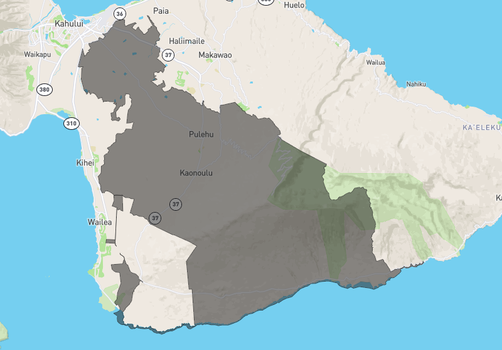
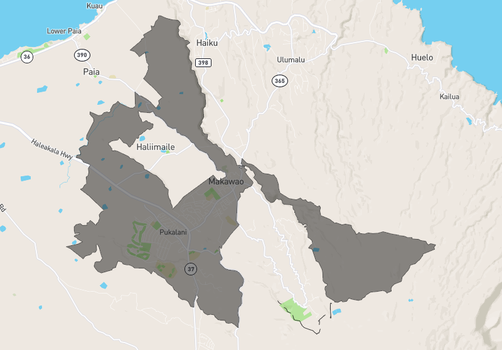
This graph details the average percent of the sold price compared to the list price on the property. This is an excellent tool for both Buyers and Sellers.
Buyers can use this tool to determine an offer price. For example, if you were going to offer on a property listed for $1m and the statistics show that the Average Percent of List Price is 97%, chances are you'll end up paying around $970,000 for that unit. If the average is 101%, you may want to consider offering full price or perhaps a little over.
Sellers can use this tool to determine a list price to increase their chances of realizing what they want out of the property. For example, if you want to realize $970,000 and the current Average Percent of List Price is 97%, you may want to consider listing your property around $1m, knowing that Buyers in this market will most likely expect a little negotiating room.

